In Ireland we get a good distribution of precipitation right across the year, but with significant concentration in the months from October through to March. We're fortunate that this 'rainy season' coincides with when we have the highest energy demand in our homes, businesses and schools, and it makes hydropower all the more ideal to meet our energy needs.
 |
| fig (i) Seasonal Precipitation and River Flow. |
As a rough guide, there's a ratio of about 2:1 between the precipitation in the winter months and in the summer months, but it would not unusual for the period from October to March to get significantly more.
Of course all this precipitation does not result in a direct correlation in the river flow. In the warm summer months the amount of moisture that evaporates form the soil is much higher than in the winter months. Also plants transpire far less moisture in the winter. The impact of this evapotranspiration can be seen in fig (i). While the ratio of winter: summer rainfall might be 2:1, the ratio of winter:summer river flow is closer to 3:1.
 |
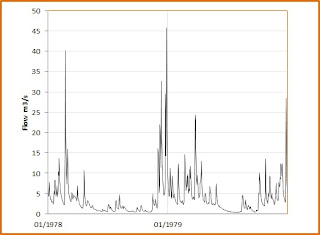
| fig. (ii) Flow at the selected location, 1978-1979 |
Any hydro scheme needs to be designed to make maximum use of the available flow while also ensuring that the 'load factor' is optimised. This is because there is a direct relationship between the installed capacity and the capital cost of a hydro project, and an excess amount of time when the turbine is not being utilised is diminishing the return on the investment.
Every hydroelectric resource is different so the turbine type and size, and the optimum load factor, would need to be worked out depending on a wide range of criteria, but of critical importance is how the low flows of the summer period are used.
 |
| fig. (iii) Seasonal electricity production relative to turbine size. |
It is also interesting to note that it is not possible to increase production over the summer period with a larger turbine. Quite the opposite in fact, as a larger turbine requires a higher minimum flow before it commences operation and is unable to make use of the low flows.
We can see that the ratio of winter/summer production moves from a ratio of 1:1 initially to 3:1, indicating a significant amount of downtime in the summer period, which can also be seen in the decline of the load factor. Figures (iv) and (v) below show how two different sized turbines would operate under the same flow conditions and criteria. While the larger turbine does produce a larger amount of electricity, it would offer a lower rate of return on investment.
 |
| Fig. (iv) Turbine abstraction 1978-1979, 1.3m/s maximum, Load factor 69% |
 |
| Fig. (v) Turbine abstraction 1978-1979. 2.6m3/s maximum Load Factor 48% |
I'll develop this section more as time goes by, so drop in again soon. If you are curious about the potential to generate hydroelectricity on any particular stream or river why not check out the Map Survey that's available on MicroHydro.ie? It's a free service.

No comments:
Post a Comment